Overview of the mdof package#

The mdof package is designed to provide a convenient interface for computing dynamic analyses of structural vibrations.
Installation#
If you’d like to install mdof in your own environment to work with it locally, install mdof from pypi. In your environment manager (e.g., Anaconda),
pip install mdof
Import#
In Python, import the package.
[1]:
import mdof
Investigate Structural Vibrations#
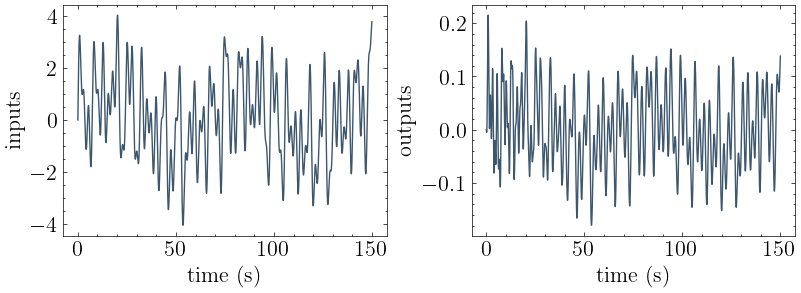
Load an the input motion, output motion, and time vector for a mystery structural system.

[2]:
import numpy as np
input_motion = np.loadtxt("uploads/input_motion.txt")
output_motion = np.loadtxt("uploads/output_motion.txt")
times = np.loadtxt("uploads/times.txt")
[3]:
from mdof.utilities.printing import plot_io
plot_io(input_motion, output_motion, times)

Inverse Eigenanalysis with mdof.eigid()#

[4]:
eigvals, eigvecs = mdof.eigid(input_motion, output_motion, order=2)
100%|█████████▉| 4700/4701 [00:00<00:00, 77332.86it/s]
[5]:
print(f"{eigvals=}\n {eigvecs=}")
eigvals=array([0.98491199+0.16330168j, 0.98491199-0.16330168j])
 eigvecs=array([[ 0.71332805+0.j        ,  0.71332805-0.j        ],
       [-0.00497201+0.70081265j, -0.00497201-0.70081265j]])
State Space Realization with mdof.sysid()#

[6]:
A,B,C,D = mdof.sysid(input_motion, output_motion, order=2)
100%|█████████▉| 4700/4701 [00:00<00:00, 87358.87it/s]
[7]:
print(f"{A=} \n{B=} \n{C=} \n{D=}")
A=array([[ 0.98607055,  0.16621799],
       [-0.16044462,  0.98375342]])
B=array([[-0.1743355 ],
       [-0.10978558]])
C=array([[-0.05126065,  0.08870003]])
D=array([[-0.09489982]])
Modal Estimation with mdof.modes()#

[8]:
modes = mdof.modes(input_motion, output_motion, dt=times[1]-times[0], order=2)
100%|█████████▉| 4700/4701 [00:00<00:00, 89928.92it/s]
[9]:
from mdof.utilities.printing import print_modes
print_modes(modes)
Spectral quantities:
       T(s)        ζ        EMACO      MPC       EMACO*MPC
      1.147      0.01       1.0        1.0        1.0
Mean Period(s): 1.1471474419090963
Standard Dev(s): 0.0
Spectra with power_transfer() and spectrum_modes()#
[10]:
from mdof.transform import power_transfer
periods, amplitudes = power_transfer(input_motion, output_motion, step=times[1]-times[0], period_band=(0,5))
[11]:
from mdof.modal import spectrum_modes
peak_period, peak_amplitude = spectrum_modes(periods, amplitudes)
print(f"{peak_period=}")
peak_period=array([1.14503817])
[12]:
from mdof.utilities.printing import plot_transfer
plot_transfer(np.array([periods,amplitudes]), plotly=True)
Stablization Diagram with stabilization()#
[13]:
from mdof.macro import stabilization
stabilization(input_motion, output_motion, dt=times[1]-times[0], orders=(2,20,2), plotly=True)
100%|█████████▉| 4700/4701 [00:00<00:00, 75231.28it/s]
100%|█████████▉| 4700/4701 [00:00<00:00, 44698.87it/s]
100%|█████████▉| 4700/4701 [00:00<00:00, 23447.11it/s]
100%|█████████▉| 4700/4701 [00:00<00:00, 16371.82it/s]
100%|█████████▉| 4700/4701 [00:00<00:00, 9064.47it/s]
100%|█████████▉| 4700/4701 [00:00<00:00, 8680.56it/s]
100%|█████████▉| 4700/4701 [00:00<00:00, 4853.57it/s]
100%|█████████▉| 4700/4701 [00:01<00:00, 3895.88it/s]
100%|█████████▉| 4700/4701 [00:01<00:00, 3513.59it/s]